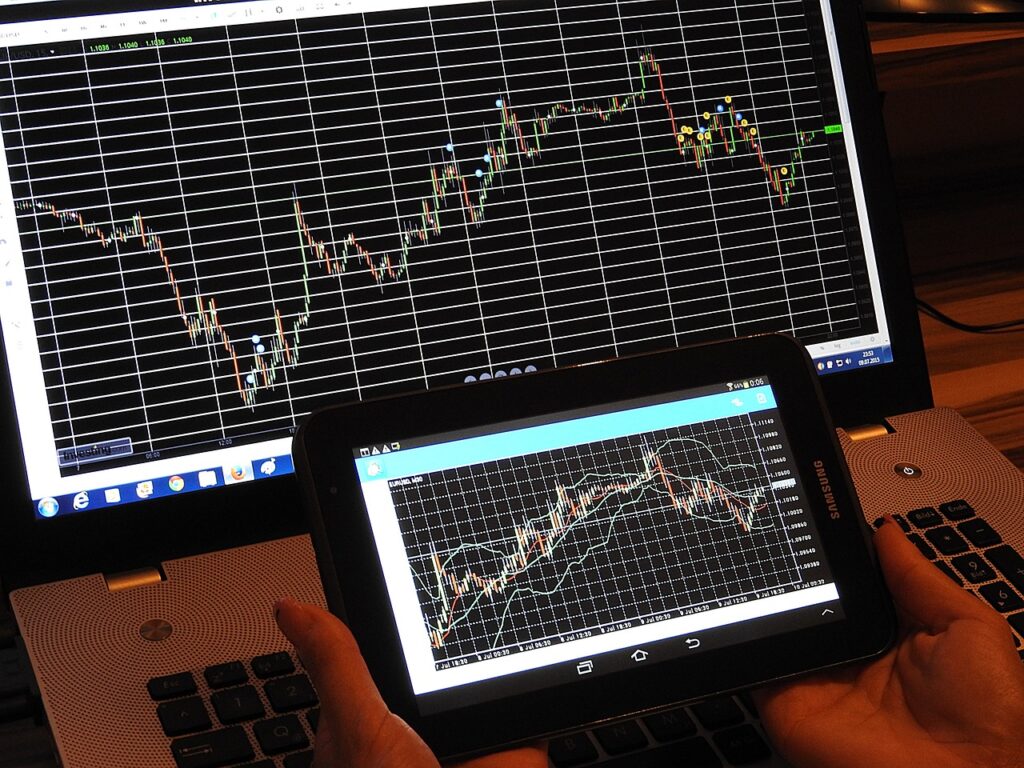
To identify potential market uptrends, monitor these key indicators:
- Moving Averages:
- Look for a golden cross where the 50-day moving average crosses above the 200-day moving average.
- Relative Strength Index (RSI):
- An RSI above 50 indicates bullish momentum; above 70 suggests overbought conditions.
- MACD:
- A bullish crossover occurs when the MACD line crosses above the signal line, signaling upward momentum.
- Volume Trends:
- Increasing volume on rising days confirms the strength of the trend.
- Chart Patterns:
- Watch for patterns like ascending triangles and cup-and-handle formations that signal upward movement.
- Bollinger Bands:
- Prices touching the upper band indicate a strong uptrend.
- Market Sentiment:
- Positive sentiment, shown by the Fear and Greed Index, reflects bullish conditions.
- Economic Indicators:
- Strong data, such as low unemployment and rising consumer confidence, supports market uptrends.
By tracking these indicators, you can effectively spot potential uptrends in the market!


